Notice
Recent Posts
Recent Comments
Link
| 일 | 월 | 화 | 수 | 목 | 금 | 토 |
|---|---|---|---|---|---|---|
| 1 | 2 | 3 | ||||
| 4 | 5 | 6 | 7 | 8 | 9 | 10 |
| 11 | 12 | 13 | 14 | 15 | 16 | 17 |
| 18 | 19 | 20 | 21 | 22 | 23 | 24 |
| 25 | 26 | 27 | 28 | 29 | 30 | 31 |
Tags
- Matplotlib
- type hint
- pandas
- programmers
- aws jupyter notebook
- 선그래프
- 코딩테스트
- 알고리즘스터디
- 파이썬
- MySQL
- 가상환경
- dataframe
- Algorithm
- NumPy
- String Method
- queue
- Join
- 데이터시각화
- 노마드코딩
- python
- 자료구조
- 알고리즘 스터디
- 알고리즘
- javascript
- 정보처리기사 c언어
- openCV
- 프로그래머스
- Stack
- 백준
- Selenium
Archives
- Today
- Total
조금씩 꾸준히 완성을 향해
[Matplotlib] 그래프 여러개 그리기(화면 분할/그래프 분할) 본문
그래프 여러개 그리기
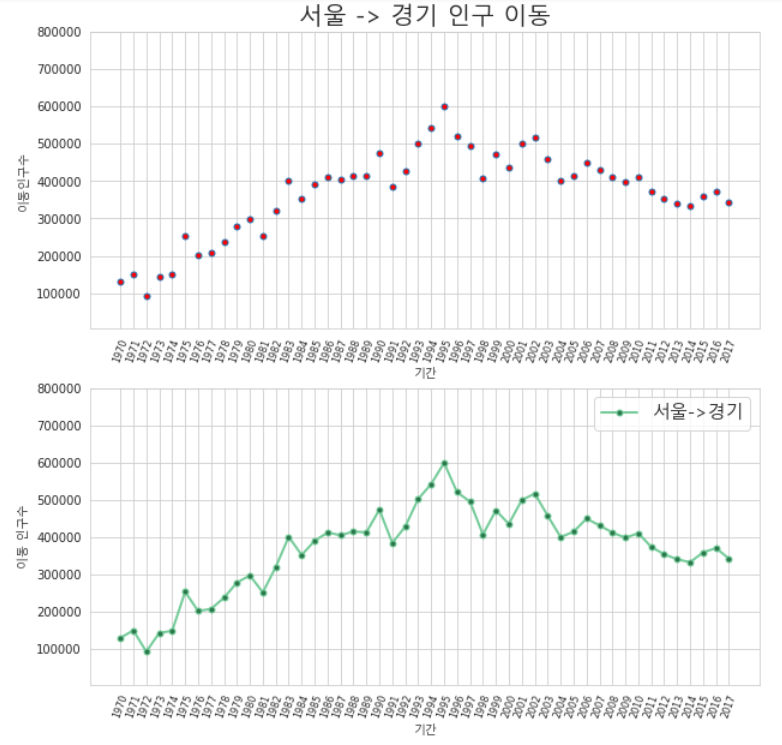
▶ axe 객체 활용
- 화면을 여러 개로 분할하고 분할된 각 화면에 서로 다른 그래프를 그리는 방법
- axe 객체는 각각 서로 다른 그래프 표현
- 한 화면에서 여러 개의 그래프를 비교하거나 다양한 정보를 동시에 보여줄 때 사용
- axe 객체를 한 개만 생성하는 경우에는 하나의 그래프만 표시
▶ figure() 함수 사용
- 그래프를 그리는 그림틀(fig) 생성
- figsize 옵션으로 (가로, 세로) 그림 틀의 크기 설정
- fig 객체에 add_subplot() 메소드를 적용하여 그림틀을 여러 개로 분할(각 부분은 axe 객체)
fig = plt.figure(figsize=(10,10)) #그래프 틀 생성 및 사이즈 지정
ax1 = fig.add_subplot(2, 1, 1) #ax1 객체 생성 : 2행 1열의 1번째 위치
ax2 = fig.add_subplot(2, 1, 2) #ax2 객체 생성 : 2행 1열의 2번째 위치

# ax1, ax2 플롯 만들기
ax1.plot(sr_one, 'o', markersize=5, markerfacecolor='red') #실선을 빼고 마커만 지정
ax2.plot(sr_one, color='#74CB99',
		marker='o', markerfacecolor='#2B784C',markersize=5, lw=2) #실선 + 마커

ax1.set_ylim(5000, 800000) #함수이름 주의 set_ylim : y축 범위 지정
ax2.set_ylim(5000, 800000)

# x축 70도 회전시키기
ax1.set_xticklabels(labels=sr_one.index, rotation=70, fontdict=dict(fontsize=8))
ax2.set_xticklabels(labels=sr_one.index, rotation=70, fontdict=dict(fontsize=8))


ax1.set_title('서울 -> 경기 인구 이동', fontproperties=mg_20) #제목달기
ax2.legend(['서울->경기'],loc='best', prop=mg_15) # 범례달기
ax1.set_xlabel('기간',fontproperties=mg_10) #x축 라벨 붙이기
ax2.set_xlabel('기간',fontproperties=mg_10)
ax1.set_ylabel('이동인구수',fontproperties=mg_10) #y축 라벨 붙이기
ax2.set_ylabel('이동 인구수',fontproperties=mg_10)

plt.show() #변경사항 저장하고 그래프 출력
같은 화면에 그래프 추가
▶ 서울에서 충청남도, 경상북도, 강원도로 이동한 인구 변화 그래프 3개를 같은 화면에 생성
# 사용할 데이터 추출해서 저장
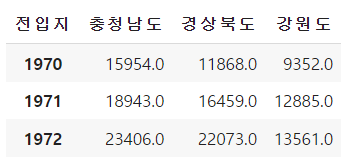
df_3 = df_seoul.loc[['충청남도','경상북도', '강원도']].T
df_3.head(3)
fig = plt.figure(figsize=(20,5)) #그래프 틀 생성 및 사이즈 지정
ax = fig.add_subplot(1, 1, 1) # ax 객체 생성 : 1행 1열 1번째 -> 하나의 그래프

# ax 객체에 세 개의 플롯 그리기
ax.plot(df_3.index, df_3['충청남도'].values, color='#74CB99',
        marker='o', markersize=8, markerfacecolor='darkgreen', label='서울->충남')
ax.plot(df_3.index, df_3['경상북도'].values, color='skyblue',
        marker='.', markersize=10, markerfacecolor='blue',label='서울->경북')
ax.plot(df_3.index, df_3['강원도'].values, color='pink',
        marker='*', markersize=10, markerfacecolor='red',label='서울->강원')

ax.set_ylim(0, 60000) #y축 범위 지정
ax.set_title('서울->충남, 경북, 강원 인구 이동', fontproperties=mg_20) #제목 붙이기
ax.set_xlabel('기간',fontproperties=mg_15) #x축 라벨 붙이기
ax.set_ylabel('인구이동수',fontproperties=mg_15) #y축 라벨 붙이기
ax.set_xticklabels(labels=df_3.index, rotation=70, fontdict=dict(fontsize=15)) #축 70도 회전
ax.legend(loc='best', prop=mg_15) #범례 붙이기

plt.show() #그래프 저장하고 보여주기

화면 4분할 그래프
# 사용할 데이터 추출해서 저장
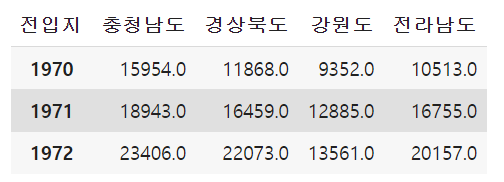
df_4 = df_seoul.loc[['충청남도','경상북도', '강원도', '전라남도']].T
df_4.head(3)
fig = plt.figure(figsize=(20,10)) #그래프 틀 생성 및 사이즈 지정

ax1 = fig.add_subplot(2, 2, 1) #ax1 객체 생성 : 2행 2열의 1번째 위치
ax2 = fig.add_subplot(2, 2, 2) #ax2 객체 생성 : 2행 2열의 2번째 위치
ax3 = fig.add_subplot(2, 2, 3) #ax3 객체 생성 : 2행 2열의 3번째 위치
ax4 = fig.add_subplot(2, 2, 4) #ax4 객체 생성 : 2행 2열의 4번째 위치

plt.subplots_adjust(wspace = 0.3, hspace = 0.3) #여백 설정

labels = ['서울->충남', '서울->경북', '서울->강원', '서울->전남'] #라벨을 리스트로 저장

# ax1~ax4 플롯 그리기(+마커추가)
ax1.plot(df_4.index, df_4['충청남도'], color='olive',
         marker='o', markerfacecolor='green', markersize=8, label=labels[0])
ax2.plot(df_4.index, df_4['경상북도'], color='skyblue',
         marker='o', markerfacecolor='blue', markersize=8, label=labels[1])
ax3.plot(df_4.index, df_4['강원도'], color='pink',
         marker='o', markerfacecolor='red',markersize=8, label=labels[2])
ax4.plot(df_4.index, df_4['전라남도'], color='yellow',
         marker='o', markerfacecolor='orange',markersize=8, label=labels[3])

axs = [ax1, ax2, ax3, ax4]
for i in range(len(axs)):  #for문으로 ax1~ax4의 정보 추가
  axs[i].set_title(labels[i], fontproperties=mg_20) #제목 추가
  axs[i].set_xticklabels(labels=df_4.index, rotation=70, fontdict=dict(fontsize=8)) #x축 70도 회전
  axs[i].legend(loc='best', prop=mg_15) #범례 추가
  axs[i].set_ylim(0,60000) #y축 범위 지정

plt.show() #변경사항 저장하고 그래프 출력

'Python > 데이터 시각화' 카테고리의 다른 글
| [Seaborn] 다양한 그래프 그리기1 (regplot, distplot, histogram, scatter plot) (0) | 2022.10.01 |
|---|---|
| [Matplotlib] 다양한 그래프 그리기(면적그래프, 막대그래프, 보조축 활용) (0) | 2022.10.01 |
| [Matplotlib] 그래프 주석 달기 & 마커 지정 (0) | 2022.09.30 |
| [Matplotlib] 그래프 스타일 지정 (그래프 디자인 변경) (0) | 2022.09.30 |
| [Matplotlib] Google Colab 한글 깨짐 (최후의 해결책) (0) | 2022.09.29 |


