Notice
Recent Posts
Recent Comments
Link
| 일 | 월 | 화 | 수 | 목 | 금 | 토 |
|---|---|---|---|---|---|---|
| 1 | 2 | 3 | ||||
| 4 | 5 | 6 | 7 | 8 | 9 | 10 |
| 11 | 12 | 13 | 14 | 15 | 16 | 17 |
| 18 | 19 | 20 | 21 | 22 | 23 | 24 |
| 25 | 26 | 27 | 28 | 29 | 30 | 31 |
Tags
- String Method
- 코딩테스트
- type hint
- programmers
- python
- pandas
- 알고리즘
- 데이터시각화
- 프로그래머스
- 정보처리기사 c언어
- MySQL
- queue
- Matplotlib
- javascript
- dataframe
- Stack
- NumPy
- Selenium
- openCV
- 알고리즘스터디
- 노마드코딩
- 백준
- aws jupyter notebook
- Join
- 자료구조
- Algorithm
- 파이썬
- 가상환경
- 선그래프
- 알고리즘 스터디
Archives
- Today
- Total
조금씩 꾸준히 완성을 향해
[Seaborn] 다양한 그래프 그리기1 (regplot, distplot, histogram, scatter plot) 본문
Python/데이터 시각화
[Seaborn] 다양한 그래프 그리기1 (regplot, distplot, histogram, scatter plot)
all_sound 2022. 10. 1. 18:46Seaborn 라이브러리
- Seaborn은 Matplotlib의 기능과 스타일을 확장한 파이썬 시각화 도구의 고급 버전
- 비교적 단순한 인터페이스 제공으로 초심자에게도 어렵지 않음
- Anaconda 설치 시 같이 설치됨
# 기본 import
import seaborn as sns
import pandas as pd
import matplotlib.pyplot as plt
from matplotlib import font_manager,rc
font_path = '' #한글 폰트 파일 path 넣기
회귀분석에서 변수들의 선형성 시각화
- sns.regplot()
- 서로 다른 2개의 연속 변수 사이의 산점도를 그리고 선형회기분석에 의한 회귀선을 함께 표시
- fig_reg=False 옵션은 회귀선을 생략
# seaborn 제공 타이타닉 데이터셋 가져오기(titanic에 저장)
titanic = sns.load_dataset('titanic')

# 스타일 테마 설정 (5가지: darkgrid, whitegrid, dark, white, ticks)
sns.set_style('whitegrid')

#그래프 객체 생성(figure에 2개 서브 플롯 생성)
fig = plt.figure(figsize=(15,5))
ax1 = fig.add_subplot(1,2,1)
ax2 = fig.add_subplot(1,2,2)

#regplot 그리기
sns.regplot(x = 'age', y = 'fare', data=titanic, ax=ax1)
sns.regplot(x = 'age', y = 'fare', data=titanic, fit_reg=False, ax=ax2) #회귀선 생략

ax1.set_xlim(0,80)
ax2.set_xlim(0,80)
ax1.set_ylim(0,550)
ax2.set_ylim(0,550)
plt.show()
히스토그램 커널 밀도 그래프
- sns.distplot()
- 단변수 데이터의 분포를 확인할 대 함수 이용
- 기본값으로 히스토그램과 커널 밀도함수를 그래프로 출력
# 그래프 객체 생성 (figure에 3개의 서브플롯을 생성)
fig = plt.figure(figsize=(15,5))
ax1 = fig.add_subplot(1,3,1)
ax2 = fig.add_subplot(1,3,2)
ax3 = fig.add_subplot(1,3,3)

# ax1에 그래프 그리기 - distplot 기본 그래프
sns.distplot(titanic['fare'],ax=ax1)

# ax2에 그래프 그리기 - hist=False 옵션 적용
sns.distplot(titanic['fare'],ax=ax2, hist=False)

# ax3에 그래프 그리기 - kde=False 옵션 적용
sns.distplot(titanic['fare'],ax=ax3, kde=False)

# title 설정
ax1.set_title('fare hist/kde', fontproperties=mg_15)
ax2.set_title('fare kde',fontproperties=mg_15)
ax3.set_title('fare hist',fontproperties=mg_15)
plt.show()
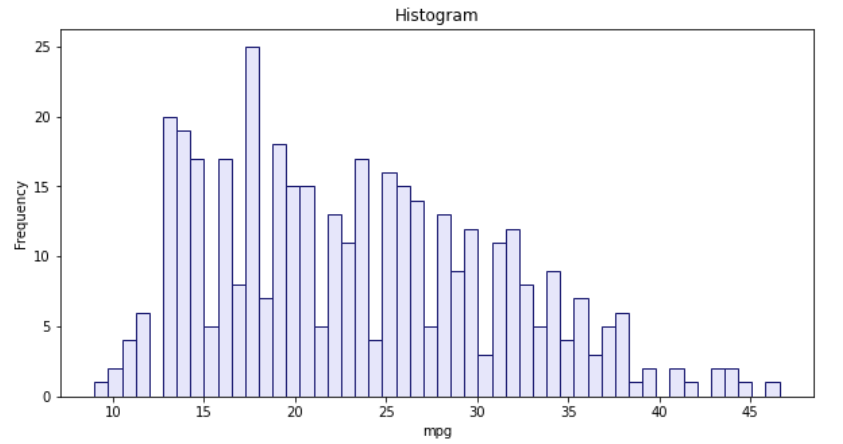
히스토그램
- plot(kind='hist')
# 자동차 연비 데이터프레임 가져와서 df_auto에 저장, 열이름 변경
df_auto = pd.read_csv('/content/drive/MyDrive/ Encore Prac/auto-mpg.csv', header = None)
df_auto.columns = ['mpg','cylinders','displacement','horsepower','weight','acceleration','model year','origin','name']

#df_auto의 mpg열 선택하여 히스토그램 생성
df6 = df_auto['mpg'].plot(figsize=(10,5),kind='hist',color='lavender', edgecolor='midnightblue',bins=50)
plt.title('Histogram')
plt.xlabel('mpg')
plt.show()
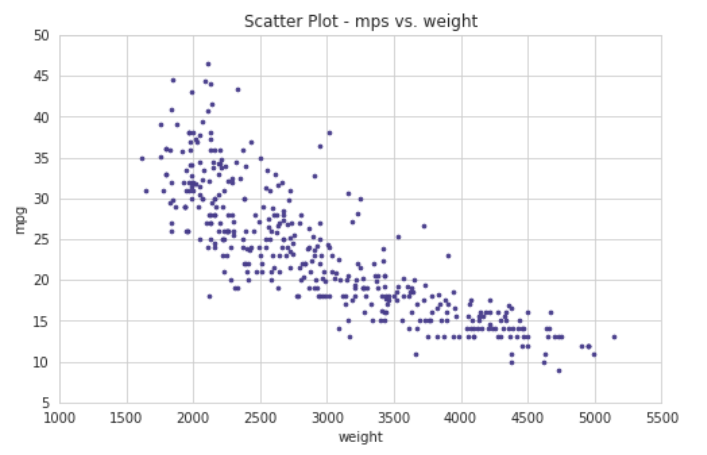
산점도
- kind= 'scatter'
▶ 기본 산점도 그리기
# 연비(mpg)와 차종(weight)열에 대한 산점도 그리기
# 점의 색상(c)와 크기(s)를 설정하는 옵션 추가
df_auto.plot('weight','mpg',kind= 'scatter', c='darkslateblue', s=7,figsize=(8,5))
plt.xlim(1000,5500)
plt.ylim(5,50)
plt.title('Scatter Plot - mps vs. weight')
plt.show()
▶ 산점도 그린 후 그림 파일로 저장
# 산점도 그린 후 그림 파일로 저장
df_auto.plot(kind='scatter', x='weight', y='mpg', marker='+', figsize=(10,5),
       cmap='viridis', c=cylinders_size, s=50, alpha=0.3)
plt.title('Scatter Plot: mpg-weight-cylinders')

# 현재 폴더에 png파일저장
plt.savefig('./scatter.png')
plt.show()
▶ for 문으로 여러 열에 대한 산점도 그리기
for i in ['cylinders','displacement','horsepower','weight','acceleration','model year']:
    df_auto.plot(kind='scatter',x=i,y='mpg',figsize=(10,5))
    plt.title(f'mpg vs {i}')
'Python > 데이터 시각화' 카테고리의 다른 글
| [Seaborn] 다양한 그래프 그리기3 (violinplot, jointplot, FacetGrid, pairplot) (0) | 2022.10.01 |
|---|---|
| [Seaborn] 다양한 그래프 그리기2 (pie chart, boxplot, heatmap, stripplot, swarmplot, barplot, countplot) (0) | 2022.10.01 |
| [Matplotlib] 다양한 그래프 그리기(면적그래프, 막대그래프, 보조축 활용) (0) | 2022.10.01 |
| [Matplotlib] 그래프 여러개 그리기(화면 분할/그래프 분할) (0) | 2022.10.01 |
| [Matplotlib] 그래프 주석 달기 & 마커 지정 (0) | 2022.09.30 |


