Notice
Recent Posts
Recent Comments
Link
| 일 | 월 | 화 | 수 | 목 | 금 | 토 |
|---|---|---|---|---|---|---|
| 1 | 2 | 3 | ||||
| 4 | 5 | 6 | 7 | 8 | 9 | 10 |
| 11 | 12 | 13 | 14 | 15 | 16 | 17 |
| 18 | 19 | 20 | 21 | 22 | 23 | 24 |
| 25 | 26 | 27 | 28 | 29 | 30 | 31 |
Tags
- python
- aws jupyter notebook
- dataframe
- 가상환경
- 데이터시각화
- 노마드코딩
- type hint
- String Method
- 선그래프
- javascript
- Algorithm
- openCV
- Selenium
- programmers
- 자료구조
- 백준
- NumPy
- 정보처리기사 c언어
- 파이썬
- MySQL
- 알고리즘 스터디
- 코딩테스트
- queue
- 알고리즘스터디
- Join
- Matplotlib
- Stack
- 알고리즘
- pandas
- 프로그래머스
Archives
- Today
- Total
조금씩 꾸준히 완성을 향해
[Seaborn] 다양한 그래프 그리기2 (pie chart, boxplot, heatmap, stripplot, swarmplot, barplot, countplot) 본문
Python/데이터 시각화
[Seaborn] 다양한 그래프 그리기2 (pie chart, boxplot, heatmap, stripplot, swarmplot, barplot, countplot)
all_sound 2022. 10. 1. 23:02파이 차트
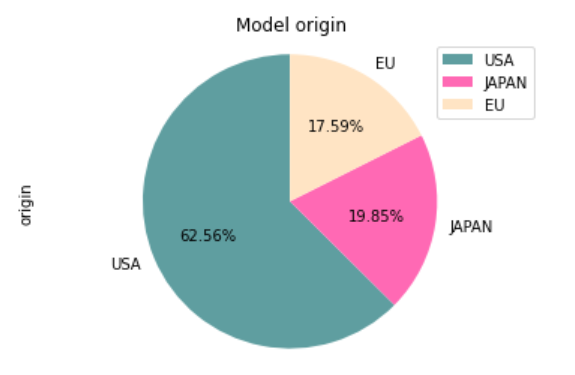
- kind='pie'
- 원을 파이 조각처럼 나누어 표현
#원산지별 자동차 개수 합계
df_origin = df_auto.origin.value_counts() #origin의 값 카운팅하기
df_origin.rename({1:'USA',2:'EU',3:'JAPAN'},inplace = True) #숫자->문자로 원산지명 변경

#파이차트 그리기( autopct:퍼센트 표기방법, startangle: 시작각도, colors:색을 리스트로 지정)
df_origin.plot(kind='pie', figsize=(6,4), autopct='%1.2f%%', startangle=90,
              colors=['cadetblue','hotpink','bisque'])

plt.title('Model origin') #제목 달기
plt.axis('equal') #축 설정
plt.legend(df_origin.index, loc='best') #원산지 인덱스를 범례로 지정
plt.show()
박스 플롯
- plt.boxplot()
- 범주형 데이터 분포 파악에 적합
- 5개의 통계 지표 제공(최소값, 1분위값, 중간값, 3분위값, 최대값)
- vert=False 옵션은 가로형 박스 플롯
# 그래프 객체 생성(figure에 2개의 서브플롯을 생성)
fig = plt.figure(figsize=(15,5))
ax1 = fig.add_subplot(1,2,1) #1행 2열의 첫번째 subplot
ax2 = fig.add_subplot(1,2,2) #1행 2열의 두번째 subplot

#박스플롯 그리기
ax1.boxplot(x=[mpg1, mpg2,mpg3], labels=['USA','EU','JAPAN']) #세로형
ax2.boxplot(x=[mpg1, mpg2,mpg3], labels=['USA','EU','JAPAN'],vert=False) #가로형

#title 설정
ax1.set_title('제조국가별 연비 분포(수직)', fontproperties=mg_15) #제목 붙이기
ax2.set_title('제조국가별 연비 분포(수평)', fontproperties=mg_15)
plt.show()
히트맵
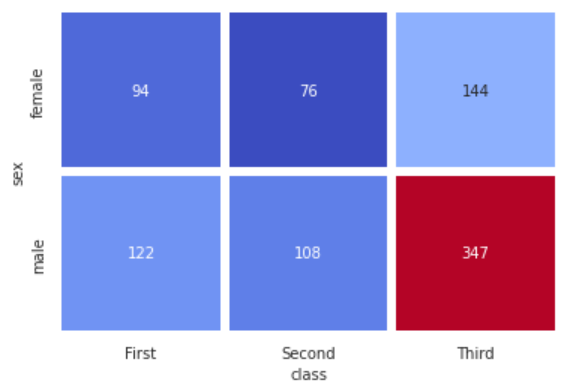
- 2개의 범주형 변수를 각각 x,y축에 놓고 데이터를 매트릭스 형태로 분류
- 데이터 프레임을 피벗 테이블로 정리할 때 한 변수를 행 인덱스, 나머지 변수를 열 이름으로 설정
- aggfunc='size' 옵션은 데이터 값을 크기를 기준으로 집계한다는 뜻
- table = titanic.pivot_table(index=['sex'], columns=['class'], aggfunc='size')
- 히트맵 그리기 heatmap()
- (데이터프레임, 데이터 값 표시 여부, 정수형 포맷, 컬러 맵, 구분선, 컬러바 표시 여부)
- aggfunc='size' 옵션은 데이터 값을 크기를 기준으로 집계한다는 뜻
# titanic 데이터로 피벗 데이블 만들기
table = titanic.pivot_table(index=['sex'], columns=['class'], aggfunc='size')

# 피벗 테이블로 히트맵 그리기
sns.heatmap(table, annot=True, fmt='d', lw=1, cbar=False, cmap='coolwarm')
# annot:데이터값 표시여부, fmt: 데이터 포멧('d'는 정수형), lw: 도형 사이 간격,
# cbar: 컬러바 표시여부, cmap: 컬러맵 설정(컬러스타일)
범주형 데이터의 산점도
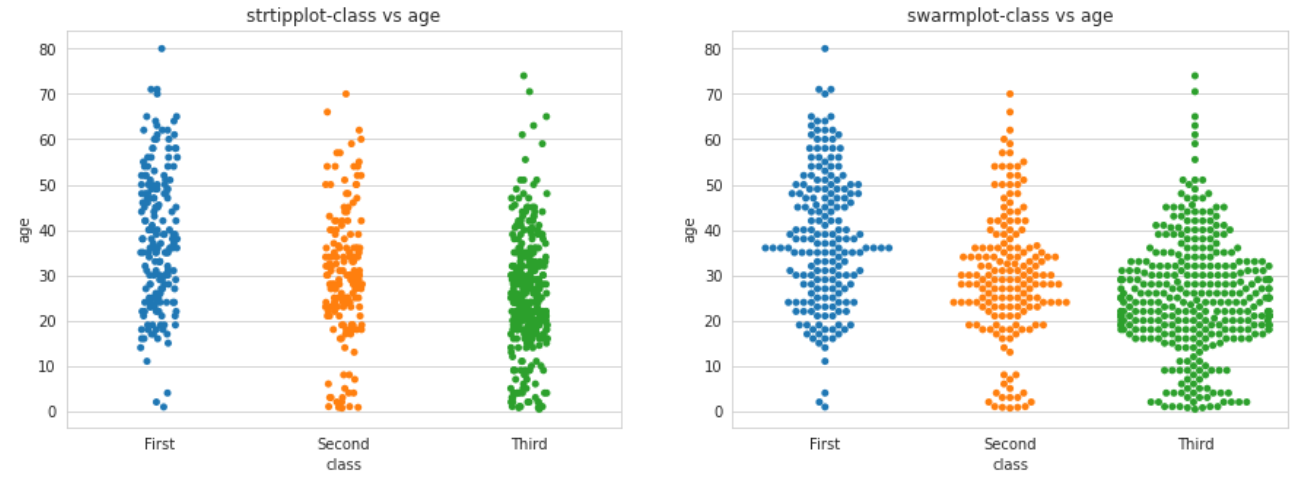
- 범주형 변수에 들어 있는 각 범주별 데이터의 분포 확인
- stripplot() : 데이터 포인트가 중복되어 범주별 분포를 그림
- swarmplot() : 데이터의 분산까지 고려하여, 데이터 포인트가 서로 중복되지 않도록 그림. 즉, 데이터가 퍼져 있는 정도를 입체적으로 표현
# 그래프 객체 생성(figure에 2개의 서브플롯을 생성)
fig = plt.figure(figsize=(15,5))
ax1 = fig.add_subplot(1,2,1)
ax2 = fig.add_subplot(1,2,2)

#그래프 그리기
sns.stripplot(x='class', y='age', data=titanic, ax=ax1) #범주별 분포(분산 고려x)
sns.swarmplot(x='class', y='age', data=titanic, ax=ax2) #범주별 분포(분산 고려o)

#title 설정
ax1.set_title('strtipplot-class vs age')
ax2.set_title('swarmplot-class vs age')
plt.show()
막대 그래프
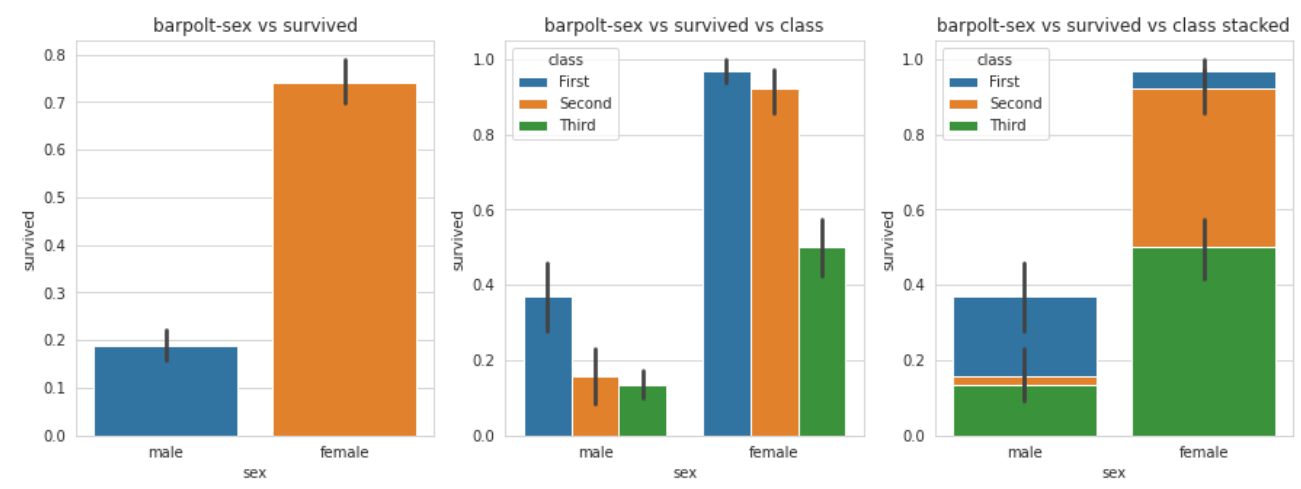
- barplot() : 지정한 변수의 평균을 계산하여 그림
- 데이터의 개수가 아닌 평균을 계산한다.
- 막대그래프 위에 덧그려진 검은 선은 95% 신뢰구간
# 그래프 객체 생성(figure에 3개의 서브플롯을 생성)
fig = plt.figure(figsize=(15,5))
ax1 = fig.add_subplot(1,3,1)
ax2 = fig.add_subplot(1,3,2)
ax3 = fig.add_subplot(1,3,3)

# 그래프 그리기
sns.barplot(x='sex', y='survived', data=titanic, ax=ax1)
sns.barplot(x='sex', y='survived',
            hue='class', data=titanic, ax=ax2) # hue: x축을 추가
sns.barplot(x='sex', y='survived',
            hue='class', data=titanic, ax=ax3, dodge=False) #dodge: 적재 여부

# title 설정
ax1.set_title('barpolt-sex vs survived')
ax2.set_title('barpolt-sex vs survived vs class')
ax3.set_title('barpolt-sex vs survived vs class stacked')
plt.show()
빈도 그래프
- countplot() : 각 범주에 속하는 데이터의 개수를 막대 그래프로 표현
# 그래프 객체 생성(figure에 3개의 서브플롯을 생성)
fig = plt.figure(figsize=(15,5))
ax1 = fig.add_subplot(1,3,1)
ax2 = fig.add_subplot(1,3,2)
ax3 = fig.add_subplot(1,3,3)

# 그래프 그리기
sns.countplot(x='class', palette='Set2', data=titanic, ax=ax1)
sns.countplot(x='class', hue='who', palette='Set2', data=titanic, ax=ax2) # hue: x축을 추가
sns.countplot(x='class', hue='who', palette='Set2', data=titanic, ax=ax3, dodge=False) #dodge: 적재해서 표현

# title 설정
ax1.set_title('titanic class')
ax2.set_title('titanic class-who')
ax3.set_title('titanic class-who(stacked)')
plt.show()
'Python > 데이터 시각화' 카테고리의 다른 글
| [Folium] 지도 만들기, Marker 표시하기 (0) | 2022.10.02 |
|---|---|
| [Seaborn] 다양한 그래프 그리기3 (violinplot, jointplot, FacetGrid, pairplot) (0) | 2022.10.01 |
| [Seaborn] 다양한 그래프 그리기1 (regplot, distplot, histogram, scatter plot) (0) | 2022.10.01 |
| [Matplotlib] 다양한 그래프 그리기(면적그래프, 막대그래프, 보조축 활용) (0) | 2022.10.01 |
| [Matplotlib] 그래프 여러개 그리기(화면 분할/그래프 분할) (0) | 2022.10.01 |


