Notice
Recent Posts
Recent Comments
Link
| 일 | 월 | 화 | 수 | 목 | 금 | 토 |
|---|---|---|---|---|---|---|
| 1 | 2 | 3 | ||||
| 4 | 5 | 6 | 7 | 8 | 9 | 10 |
| 11 | 12 | 13 | 14 | 15 | 16 | 17 |
| 18 | 19 | 20 | 21 | 22 | 23 | 24 |
| 25 | 26 | 27 | 28 | 29 | 30 | 31 |
Tags
- NumPy
- 선그래프
- python
- queue
- Join
- programmers
- Matplotlib
- 파이썬
- 백준
- 알고리즘
- dataframe
- 알고리즘스터디
- pandas
- aws jupyter notebook
- MySQL
- type hint
- 프로그래머스
- 정보처리기사 c언어
- 코딩테스트
- Algorithm
- 알고리즘 스터디
- javascript
- 노마드코딩
- Stack
- String Method
- openCV
- 데이터시각화
- Selenium
- 자료구조
- 가상환경
Archives
- Today
- Total
조금씩 꾸준히 완성을 향해
[OpenCV/Python] 이미지 불러오기 & 읽기 & 저장하기 본문
▶ openCV install
pip install opencv-pythonimport cv2# 버전 확인
cv2.version.opencv_version
# '4.6.0.66'▶ Image read
imagefile = './lena.jpg' #파일 경로 지정# color (칼라로 가져오기)
img = cv2.imread(imagefile)
print(img.shape)
# (512, 512, 3)# grayscale (흑백으로 가져오기)
img2 = cv2.imread(imagefile, 0)
print(img.shape)
# (512, 512, 3)cv2.startWindowThread()
cv2.imshow('Lena color', img) #칼라사진 띄우기
cv2.imshow('Lena grayscale', img2) #흑백사진 띄우기
cv2.waitKey()
cv2.destroyAllWindows()
▶ image save
# 다양한 확장자로 저장 가능
cv2.imwrite('./Lena.bmp', img)
cv2.imwrite('./Lena.png', img)
cv2.imwrite('./Lena2.png', img2)
cv2.imwrite('./Lena2.bmp', img2)
▶color image display
# matplotlib을 쓰면 이미지를 새로운 창으로 열지 않고도 jupyter notebook에서 출력 가능
import matplotlib.pyplot as plt
imagefile = './lena.jpg'
# default => bgr(blue, green, red)
# 그냥 가져오면 bgr 형식으로 blue 색상이 가장 위에 위치
img_bgr = cv2.imread(imagefile)
plt.axis('off') # 축삭제
plt.imshow(img_bgr)
plt.show()
# 흔히 보는 사진인 rgb 형식으로 변경 (red가 가장 위에 위치)
# bgr => rgb(red, green, blue)
img_rgb = cv2.cvtColor(img_bgr, cv2.COLOR_RGB2BGR)
plt.axis('off')
plt.imshow(img_rgb)
plt.show()
▶ gray image display
# 흑백으로 변경
img_gray = cv2.imread(imagefile, cv2.IMREAD_GRAYSCALE)
plt.axis('off')
plt.imshow(img_gray, cmap='gray', interpolation='nearest')
plt.show()
- interpolation(보간법)
- 픽셀들의 축 위치 간격을 보정하여 이미지가 자연스러운 모양으로 보일 수 있게 하는 방법
- imshow에는 16가지 보간법이 있고, 'nearest'는 가장 고해상도
▶ margin image save
# 이미지에 margin 값 주기
img_gray = cv2.imread(imagefile, cv2.IMREAD_GRAYSCALE)
plt.figure(figsize=(4,4))
plt.subplots_adjust(left=0, right=0.5, bottom=0, top=0.5) #margin 값 설정
plt.imshow(img_gray, cmap='gray')
plt.axis('off')
plt.show()
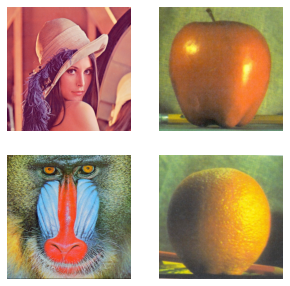
▶ subplot image display
- lena, apple, baboon, orange images => (2,2)
# 2행 2열의 subplot으로 이미지 정렬
img_bgr1 = cv2.imread('./lena.jpg')
img_bgr2 = cv2.imread('./apple.jpg')
img_bgr3 = cv2.imread('./baboon.jpg')
img_bgr4 = cv2.imread('./orange.jpg')
img_rgb1 = cv2.cvtColor(img_bgr1, cv2.COLOR_BGR2RGB)
img_rgb2 = cv2.cvtColor(img_bgr2, cv2.COLOR_BGR2RGB)
img_rgb3 = cv2.cvtColor(img_bgr3, cv2.COLOR_BGR2RGB)
img_rgb4 = cv2.cvtColor(img_bgr4, cv2.COLOR_BGR2RGB)

fig = plt.figure(figsize=(5,5))
ax1 = fig.add_subplot(221)
ax2 = fig.add_subplot(222)
ax3 = fig.add_subplot(223)
ax4 = fig.add_subplot(224)

ax1.axis('off')
ax2.axis('off')
ax3.axis('off')
ax4.axis('off')

ax1.imshow(img_rgb1)
ax2.imshow(img_rgb2)
ax3.imshow(img_rgb3)
ax4.imshow(img_rgb4)

plt.show()
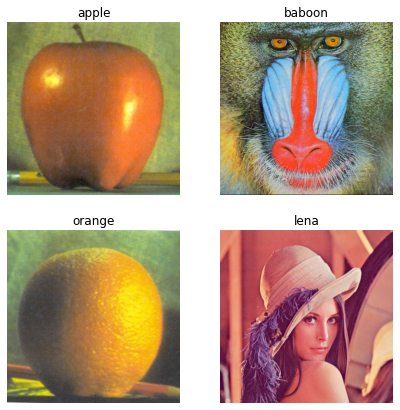
# 짧은 코드로 정리해 보기
names = ['apple', 'baboon', 'orange', 'lena']
for i in range(4):
    img = cv2.imread(f'./{names[i]}.jpg')
    globals()[f'img{i+1}'] = cv2.cvtColor(img, cv2.COLOR_RGB2BGR)
fig =  plt.figure(figsize=(7,7))
for i in range(4):
    ax = fig.add_subplot(2, 2, i+1)
    ax.imshow(globals()[f'img{i+1}'])
    ax.set_title(names[i])
    ax.axis('off')
plt.show()


