Notice
Recent Posts
Recent Comments
Link
| 일 | 월 | 화 | 수 | 목 | 금 | 토 |
|---|---|---|---|---|---|---|
| 1 | 2 | 3 | ||||
| 4 | 5 | 6 | 7 | 8 | 9 | 10 |
| 11 | 12 | 13 | 14 | 15 | 16 | 17 |
| 18 | 19 | 20 | 21 | 22 | 23 | 24 |
| 25 | 26 | 27 | 28 | 29 | 30 | 31 |
Tags
- MySQL
- 노마드코딩
- 선그래프
- python
- openCV
- Matplotlib
- String Method
- aws jupyter notebook
- programmers
- Algorithm
- NumPy
- javascript
- 정보처리기사 c언어
- 자료구조
- 코딩테스트
- Join
- 알고리즘
- 알고리즘 스터디
- 파이썬
- dataframe
- queue
- Stack
- type hint
- 가상환경
- 데이터시각화
- Selenium
- 알고리즘스터디
- pandas
- 백준
- 프로그래머스
Archives
- Today
- Total
조금씩 꾸준히 완성을 향해
[OpenCV/Python] 히스토그램(Histogram) 그래프 & 스트레칭 & 평활화 (normalize, equalize) 본문
Python/OpenCV
[OpenCV/Python] 히스토그램(Histogram) 그래프 & 스트레칭 & 평활화 (normalize, equalize)
all_sound 2022. 11. 13. 10:56# 히스토그램
import cv2
import numpy as np
import matplotlib.pyplot as plt

src = np.array([[0,0,0,0],
                [1,1,3,5],
                [6,1,1,3],
                [4,3,1,7]], dtype=np.uint8) #영상으로 지정한 배열

#히스토그램 계산(사이즈 4, 8 / 범위 0~7, 0~4 나누어 계산)
hist1 = cv2.calcHist(images=[src], channels=[0], mask=None, histSize=[4], ranges=[0,8])
hist2 = cv2.calcHist(images=[src], channels=[0], mask=None, histSize=[8], ranges=[0,8])
hist3 = cv2.calcHist(images=[src], channels=[0], mask=None, histSize=[4], ranges=[0,5])
print('hist1:', hist1)
print('hist2:', hist2)
print('hist3:', hist3)
# 레나 이미지 (사이즈 32, 범위전체), (사이즈 256, 범위 전체) 히스토그램 구하기

src = cv2.imread('./lena.jpg', 0)

hist1 = cv2.calcHist(images=[src], channels=[0], mask=None, histSize=[32], ranges=[0, 256])
hist2 = cv2.calcHist(images=[src], channels=[0], mask=None, histSize=[256], ranges=[0, 256])

print('hist1:', hist1)
print('hist2:', hist2)
# 두 histogram 1차원 백터로 변경
hist1 = hist1.flatten()
hist2 = hist2.flatten()# 선, 막대 그래프 그리기
fig = plt.figure(figsize=(10, 7))
ax1 = fig.add_subplot(2, 2, 1)
ax2 = fig.add_subplot(2, 2, 2)
ax1.plot(hist1, color='red')
ax1.bar(np.arange(32), hist1, color='skyblue')
ax1.set_title('histSize=[32]')
ax2.plot(hist2, color='red')
ax2.bar(np.arange(256), hist2, color='pink')
ax2.set_title('histSize=[256]')
plt.show()
# 히스토그램 스트레칭
- normalize 0~255 적용한 상태, 히스토그램 그려보기
src = cv2.imread('./lena.jpg', 0)
dst = cv2.normalize(src, None, 0, 255, cv2.NORM_MINMAX)
hist = cv2.calcHist(images=[dst], channels=[0], mask=None, histSize=[256], ranges=[0, 256])
hist = hist.flatten()

plt.plot(hist, color='red')
plt.bar(np.arange(256), hist, color='skyblue')
plt.title('normalization')
plt.show()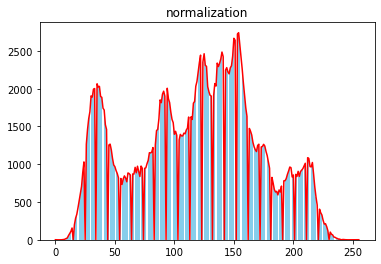
- hawkes 이미지, 명암비 히스토그램 확인 후 선명하게 변경해 보기
# hawkes 실제 이미지, 명암비 히스토그램 확인  후 선명하게 변경해 보기
src = cv2.imread('./hawkes.bmp', 0)
print(src.shape) # (400, 600)
print(src.max()) # 228
print(src.min()) # 105
# without nomalization
hist1 = cv2.calcHist(images=[src], channels=[0], mask=None, histSize=[256], ranges=[0, 256])
hist1 = hist1.flatten()
plt.plot(hist1, color='red')
plt.bar(np.arange(256), hist1, color='skyblue')
plt.title('original')
plt.show()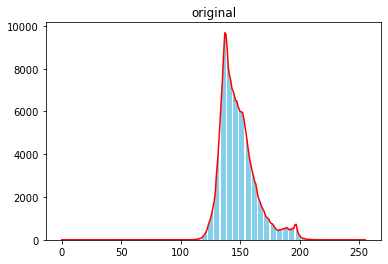
# with nomalization
dst = cv2.normalize(src, None, 0, 255, cv2.NORM_MINMAX)
hist2 = cv2.calcHist(images=[dst], channels=[0], mask=None, histSize=[256], ranges=[0, 256])

plt.plot(hist2.flatten(), color='pink')
plt.bar(np.arange(256), hist2.flatten(), color='blue')
plt.title('normalization')
plt.show()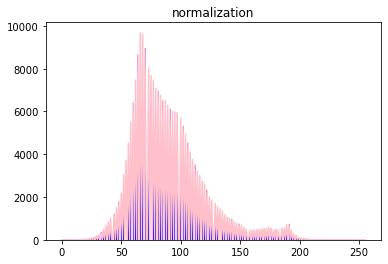
# 이미지 비교
cv2.imshow('original', src)
cv2.imshow('normalization', dst)
cv2.waitKey()
cv2.destroyAllWindows()
- 스트레칭이 불가한 경우
# 픽셀의 최소값과 최대값이 이미 존재하는 경우
src[0,0] = 0
src[1,1] = 255
dst = cv2.normalize(src, None, 0, 255, cv2.NORM_MINMAX)
cv2.imshow('src', src)
cv2.imshow('dst', dst)
cv2.waitKey()
cv2.destroyAllWindows()
# 결과 변화가 없다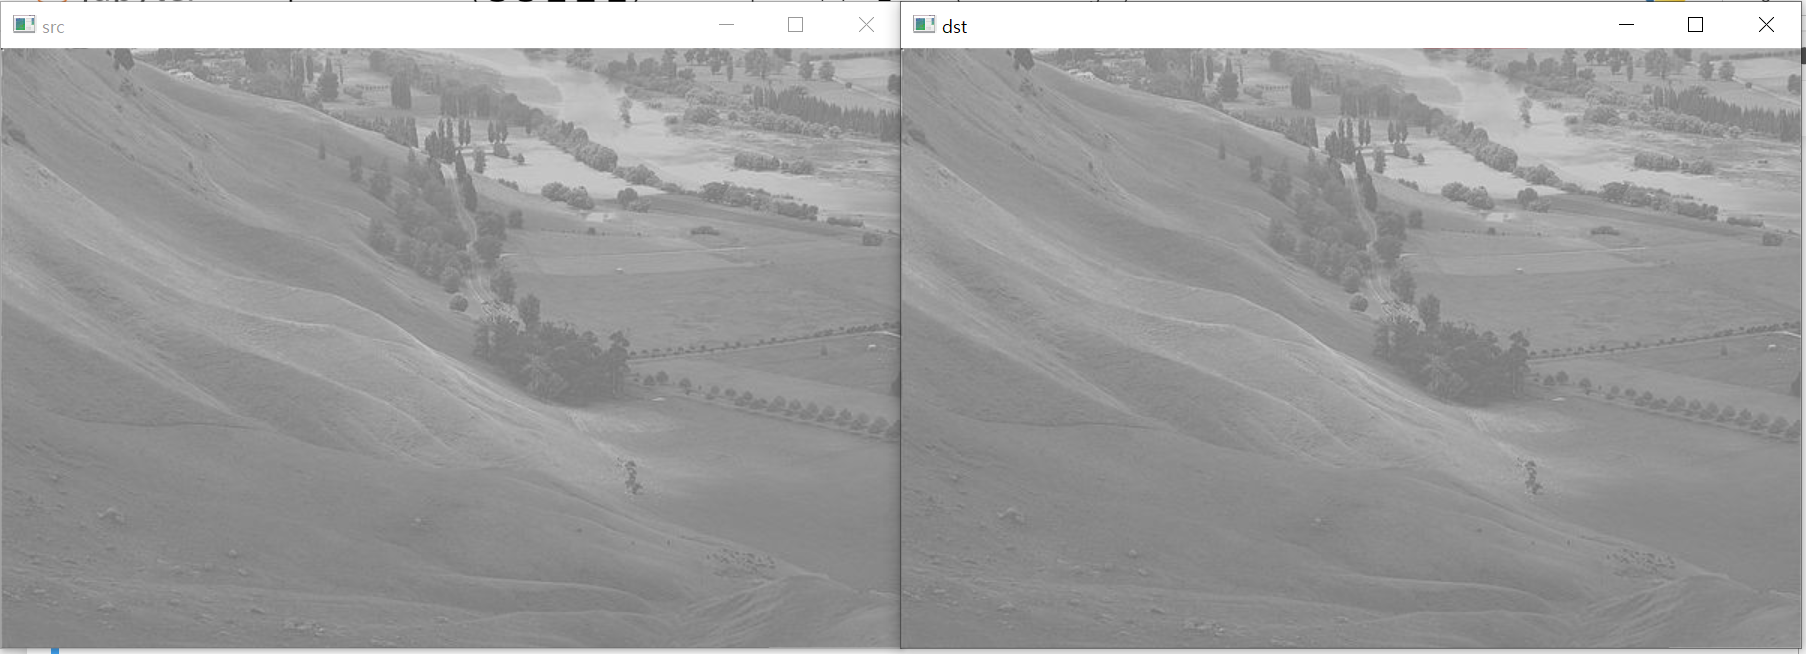
# 히스토그램 평활화
- 영상의 픽셀 값 분포가 그레이스케일 전체영역에서 균일하게 분포하도록 변경하는 알고리즘
- 특정 밝기 값 근방에 몰려 있는 픽셀 분포를 분산
- 히스토그램 누적 함수 H(g)를 이용하여 계산
import matplotlib.pyplot as plt

src = np.array([[0,0,0,0],
                [1,1,3,5],
                [6,1,1,3],
                [4,3,1,7]], dtype=np.uint8)

dst1 = ((src - np.min(src))/(np.max(src) - np.min(src))) * 255  # nomalize
dst1 = np.uint8(dst1) # 8비트 정수 타입 변경

dst2 = cv2.equalizeHist(src)

fig = plt.figure(figsize=(15, 5))
ax1 = fig.add_subplot(1, 2, 1)
ax2 = fig.add_subplot(1, 2, 2)
ax1.hist(dst1.flatten(), range=[0, 256], bins=256)
ax1.set_title('normalization')
ax2.hist(dst2.flatten(), range=[0, 256], bins=256, color='pink')
ax2.set_title('equalization')
plt.show()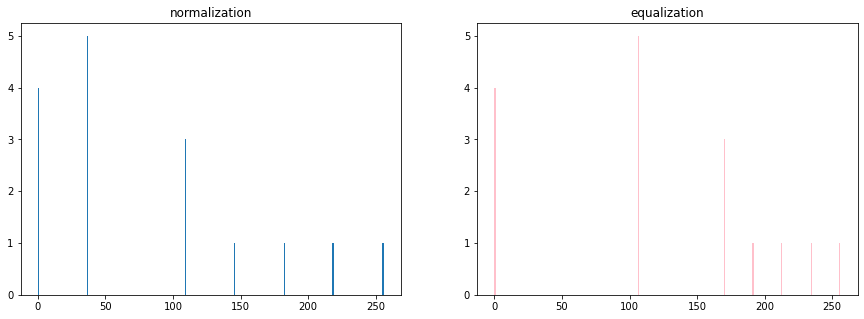
- lena 활용 스트레칭 vs 평활화
src = cv2.imread('./lena.jpg', 0)
dst1 = cv2.normalize(src, None, 0, 255, cv2.NORM_MINMAX)
dst2 = cv2.equalizeHist(src)

fig = plt.figure(figsize=(15, 5))
ax1 = fig.add_subplot(1, 2, 1)
ax2 = fig.add_subplot(1, 2, 2)

ax1.hist(dst1.flatten(), range=[0, 256], bins=256, color='skyblue')
ax1.set_title('normalization')
ax2.hist(dst2.flatten(), range=[0, 256], bins=256, color='pink')
ax2.set_title('equalization')
plt.show()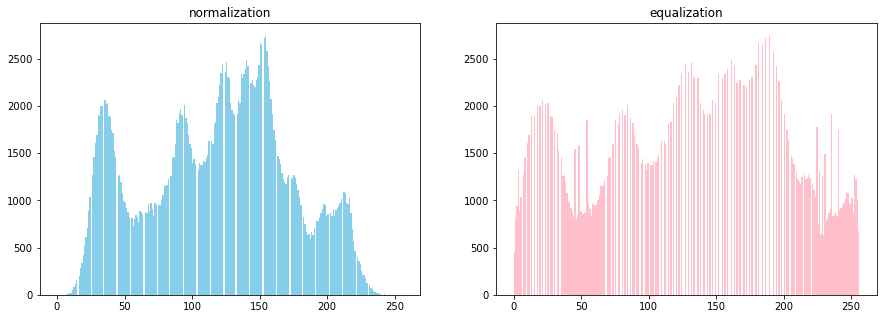
# 이미지 비교
cv2.imshow('normalization', dst1)
cv2.imshow('equalization', dst2)
cv2.waitKey()
cv2.destroyAllWindows()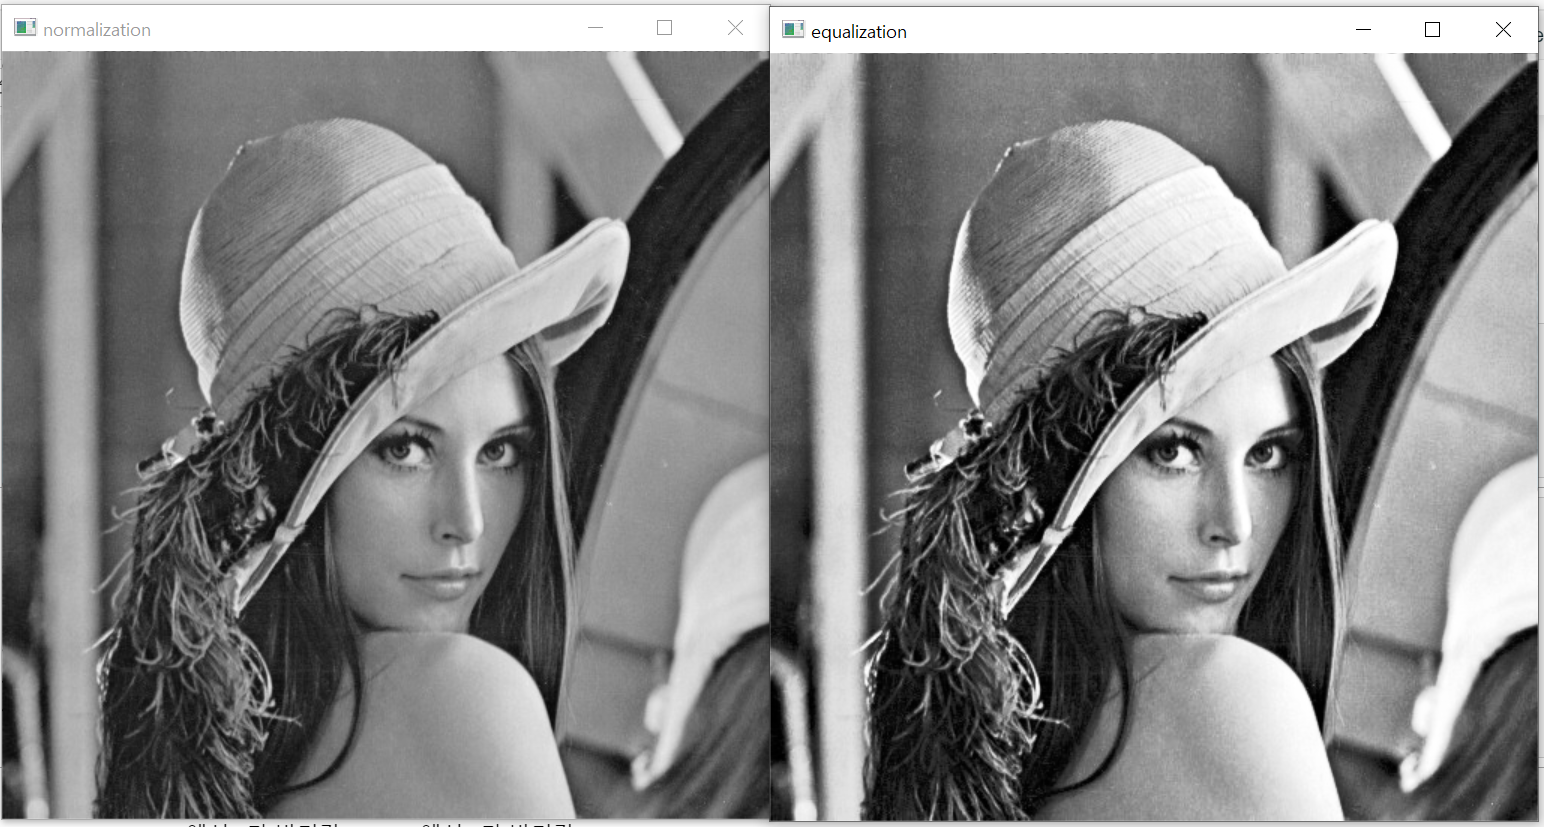
# normalize 불가했던 케이스 가져와서 equalize
src = cv2.imread('./hawkes.bmp', 0)
src[0,0] = 0
src[1,1] = 255
dst = cv2.equalizeHist(src)
cv2.imshow('src', src)
cv2.imshow('dst', dst)
cv2.waitKey()
cv2.destroyAllWindows()
# 성공!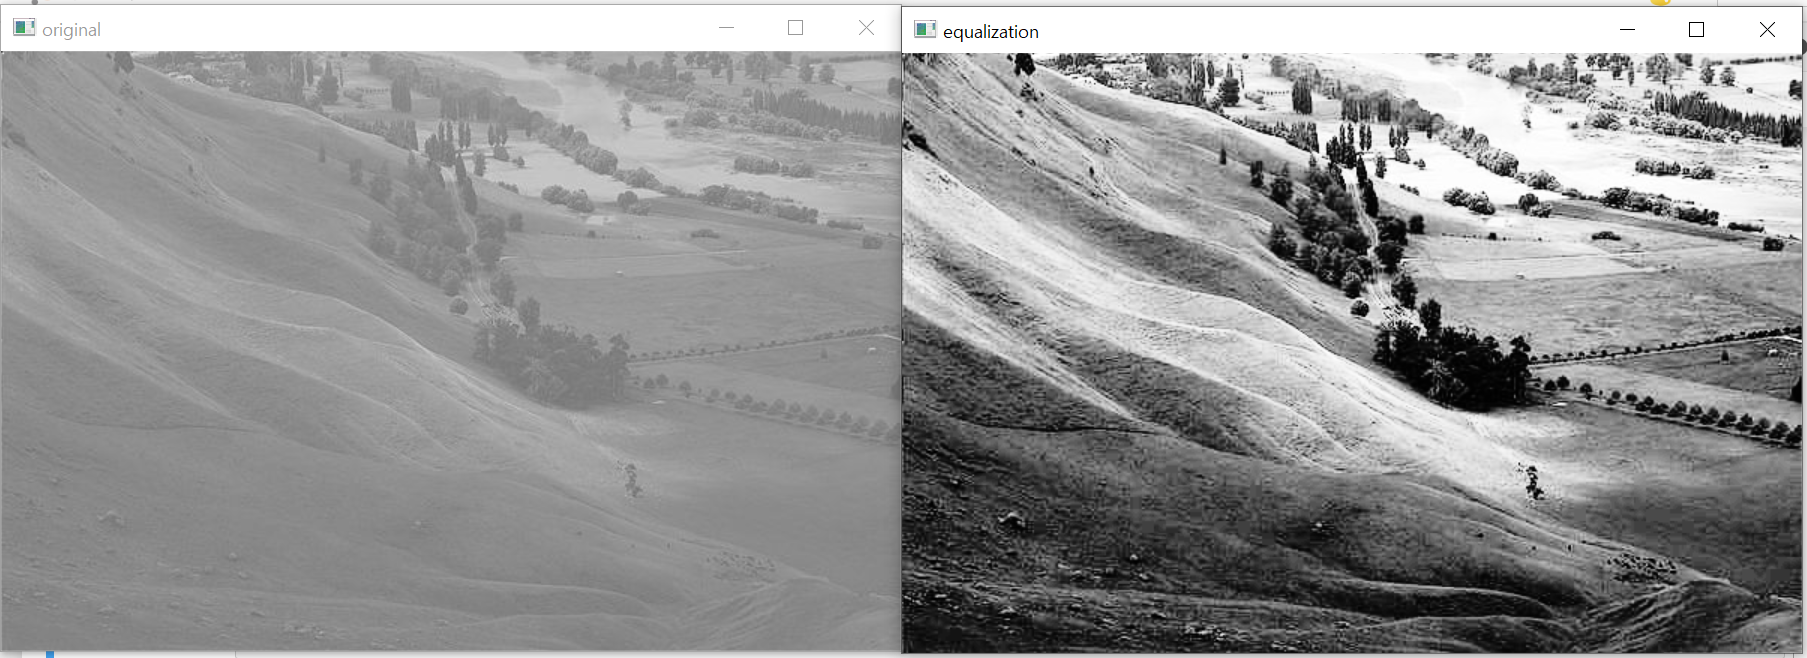
- 컬러 영상 히스토그램 평활화 적용
- HSV에서 v가 밝기값, YCrCb에서 y가 밝기값
src = cv2.imread('./lena.jpg')

# hsv, yCrCy 형태로 이미지 변경
hsv = cv2.cvtColor(src, cv2.COLOR_BGR2HSV)
yCrCy = cv2.cvtColor(src, cv2.COLOR_BGR2YCrCb)

# split으로 channel 나누기
h, s, v = cv2.split(hsv)
y, Cr, Cv = cv2.split(yCrCy)

# 명도(v, y)만 히스토그램 equalization
v2 = cv2.equalizeHist(v)
y2 = cv2.equalizeHist(y)

fig = plt.figure(figsize=(15, 10))
ax1 = fig.add_subplot(2, 2, 1)
ax2 = fig.add_subplot(2, 2, 2)
ax3 = fig.add_subplot(2, 2, 3)
ax4 = fig.add_subplot(2, 2, 4)

# 원래 명도와 평활화 후 명도 비교
ax1.hist(v.flatten(), range=[0, 256], bins=256)
ax1.set_title('hsv_v')
ax2.hist(y.flatten(), range=[0, 256], bins=256)
ax2.set_title('yCrCy_y')
ax3.hist(v2.flatten(), range=[0, 256], bins=256)
ax3.set_title('hsv_v_equalization')
ax4.hist(y2.flatten(), range=[0, 256], bins=256)
ax4.set_title('yCrCy_y_equalization')

plt.show()
# merge로 channel 결합
hsv2 = cv2.merge([h, s, v2])
yCrCv2 = cv2.merge([y2, Cr, Cv])

# BGR로 변환
dst1 = cv2.cvtColor(hsv2, cv2.COLOR_HSV2BGR)
dst2 = cv2.cvtColor(yCrCv2, cv2.COLOR_YCrCb2BGR)

# 결과 확인
cv2.imshow('hsv', dst1)
cv2.imshow('yCrCv2', dst2 )
cv2.waitKey()
cv2.destroyAllWindows()
